While first-time buyers come from all different backgrounds, they do share similarities in what they buy, how much they spend and what their financial situation is. With the help of the National Association of REALTORS® (NAR) 2017 Profile of Home Buyers and Sellers, we can determine the following:
First-time buyers are dealing with a variety of obstacles when entering the market. These run the gamut from student loan debt to saving for their down payment. However, according to the report, a lack of education is the underlying problem, as 80 percent of surveyed non-homeowners believe they need to put down 10 percent or more when purchasing a home. And while affordability issues remain a constant struggle for first-time buyers, those surveyed reported that finding the right home was the biggest challenge—a problem that arises due to limited inventory.
It's not all challenges when it comes to home-buying. Thanks to loosening restrictions from lending institutions, it's easier than ever for first-time buyers to get a mortgage through special programs with low down payment options and low interest rates. One popular option is the Federal Housing Administration (FHA) loan, used by 34 percent of first-time homebuyers (up from 33 percent in 2016), according to the report.
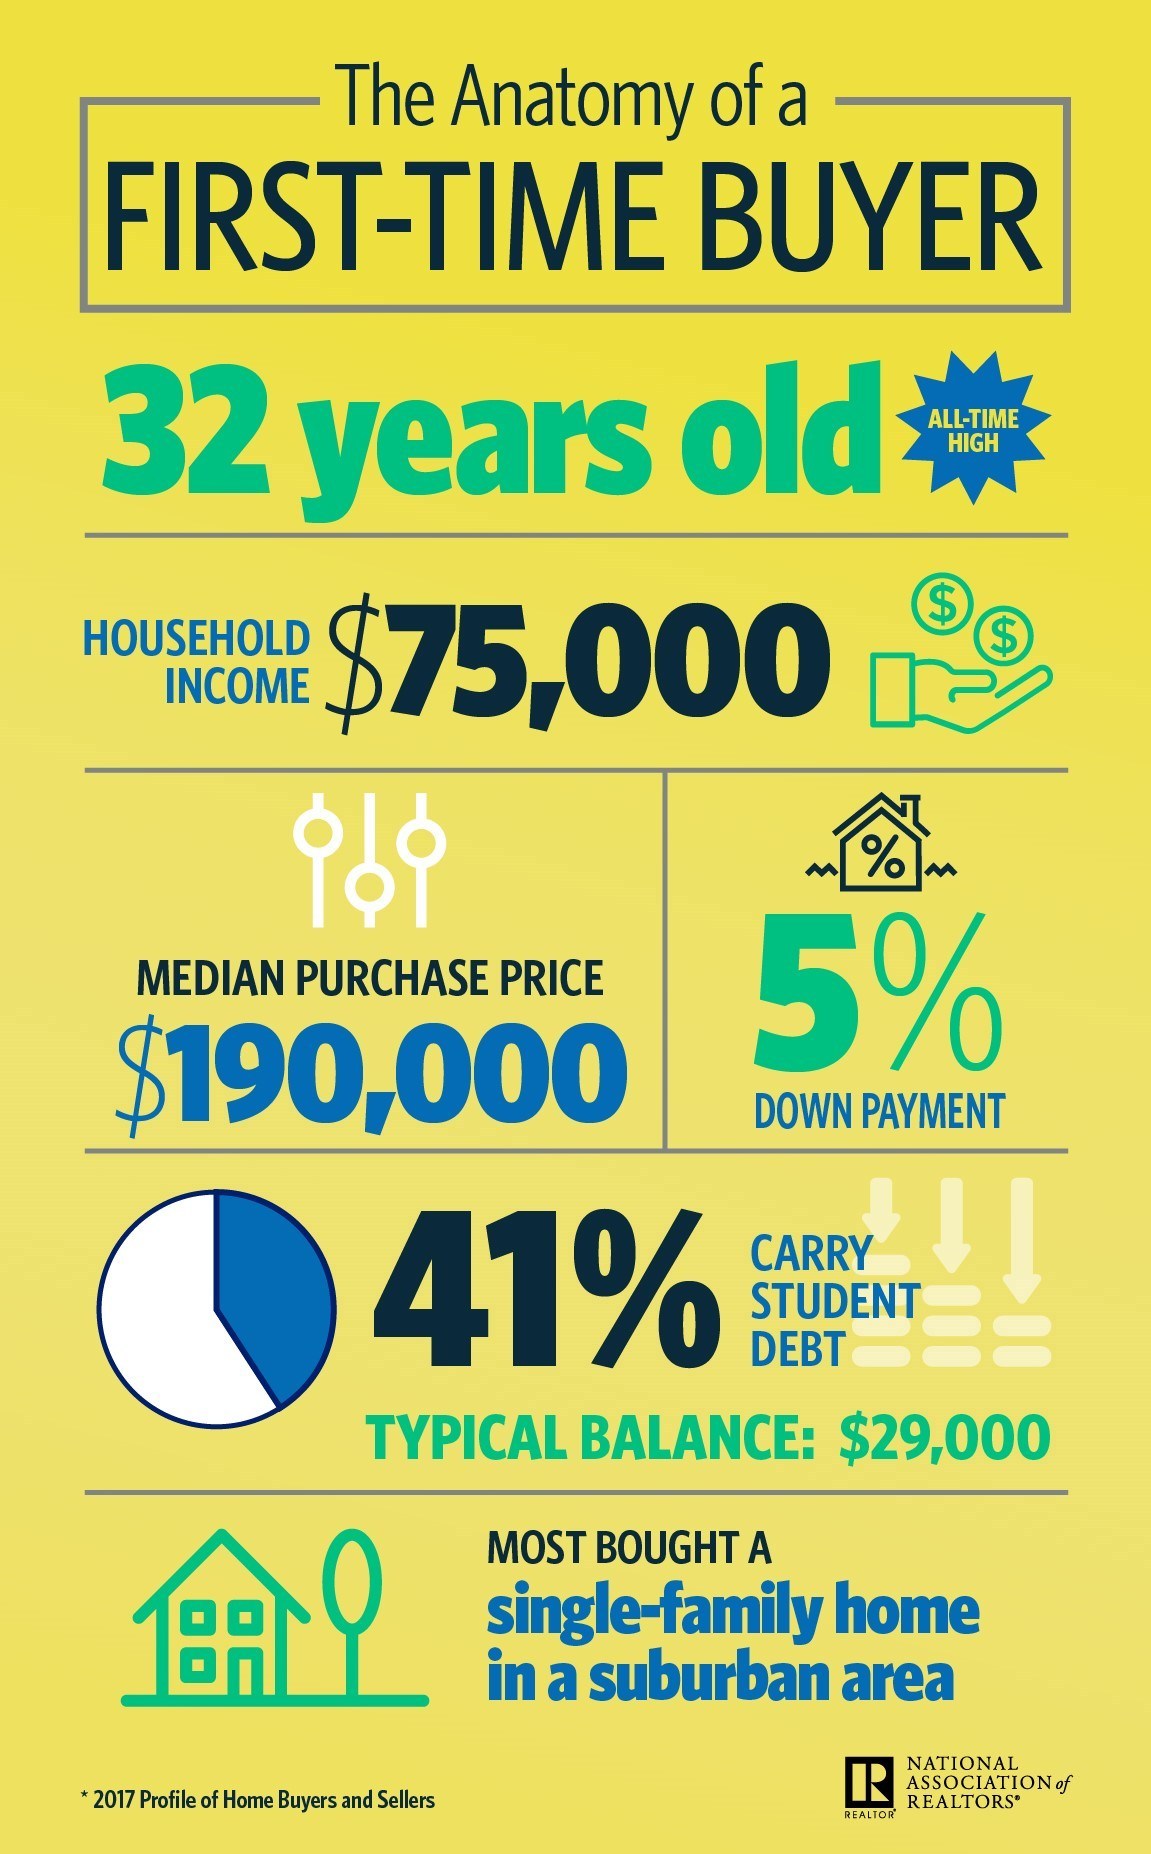
So, what are first-timers after when it comes to buying? The following infographic provided by NAR—The Anatomy of a First-Time Buyer—breaks down the average purchase price, age, down payment amount and more of today's first-time homebuyers.
The average first-time homebuyer…
- Is 32 years old
- Has a household income of $75,000
- Purchases a $190,000 home
- Puts down 5 percent
- Has $29,000 in student loan debt
- Buys a single-family home in a suburban area
For more information, please visit www.nar.realtor.