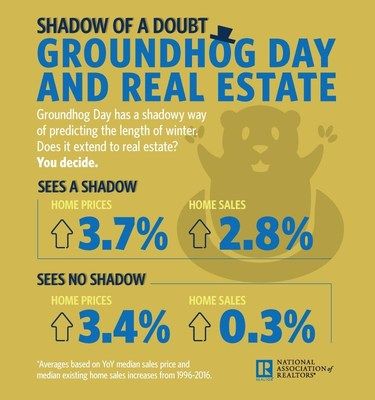
Can a groundhog and his shadow predict the strength of the housing market? Here is what happened the past 20 years in real estate when Punxsutawney Phil climbed out of his hole; does seeing his shadow extend to real estate? You decide.
|
Shadow of a Doubt: Groundhog Day and Real Estate |
|||||||
|
Year |
Shadow |
Home Sales Increase |
Home Price Increase |
Year |
Shadow |
Home Sales |
Home Prices |
|
1996 |
Yes |
8.3 |
4.6 |
2007 |
No |
-22.3 |
-1.3 |
|
1997 |
No |
5.0 |
5.2 |
2008 |
Yes |
-18.3 |
-9.5 |
|
1998 |
Yes |
13.5 |
5.3 |
2009 |
Yes |
5.6 |
-12.9 |
|
1999 |
No |
4.3 |
3.9 |
2010 |
Yes |
-3.5 |
0.2 |
|
2000 |
Yes |
-0.1 |
4.1 |
2011 |
No |
1.7 |
-3.9 |
|
2001 |
Yes |
3.1 |
6.6 |
2012 |
Yes |
9.4 |
6.4 |
|
2002 |
Yes |
5.6 |
7.7 |
2013 |
No |
9.2 |
11.5 |
|
2003 |
Yes |
9.6 |
8.4 |
2014 |
Yes |
-2.9 |
5.7 |
|
2004 |
Yes |
9.7 |
9.3 |
2015 |
Yes |
6.3 |
6.8 |
|
2005 |
Yes |
4.5 |
12.4 |
2016 |
No |
3.8 |
5.2 |
|
2006 |
Yes |
-8.5 |
1.0 |
Sees no shadow |
0.3 |
3.4 |
|
|
Sees a shadow |
2.8 |
3.7 |
|||||

*Averages based on YoY median sales price and median existing home sales increases from 1996-2016.
Source: NAR


